A cap table you can interrogate
The same live cap table becomes a modelling surface — travel back to any date, stress-test an exit against your recorded class rights, or model a raise. Analysis is a lens on the register, never a write to it: nothing changes what's actually on issue until a resolution passes and is approved.
Modelling never touches the register — change flows only through a passed resolution.
Illustrative — Solstice Labs demo data
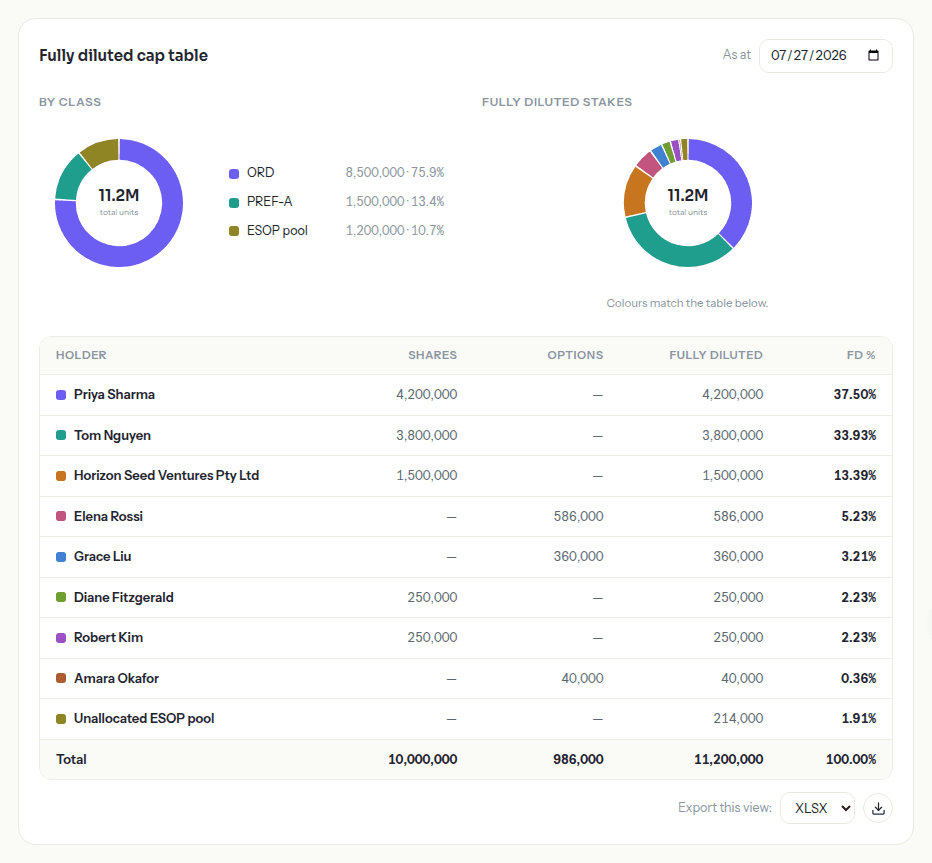
One cap table, always live
Donuts and the underlying table are colour-linked — hover either and the other highlights the same holder or class, because colour follows the entity, not its rank on the day. A vesting forecast sits alongside it, projecting cumulative vested units against the same live grants, no separate spreadsheet. Switch the "as at" date and the whole view rewinds to what the register actually showed then, export included, so a board pack or an investor update can quote an exact historical position rather than an approximation. It's the same register the ASIC hub and the option register read from too — one number, however many ways you look at it.
- Linked donuts and table — hover one, the other highlights
- The "as at" date rewinds the view to what the register showed then, and the export carries that date
- Fully diluted includes the ESOP pool and its headroom, not just shares currently on issue
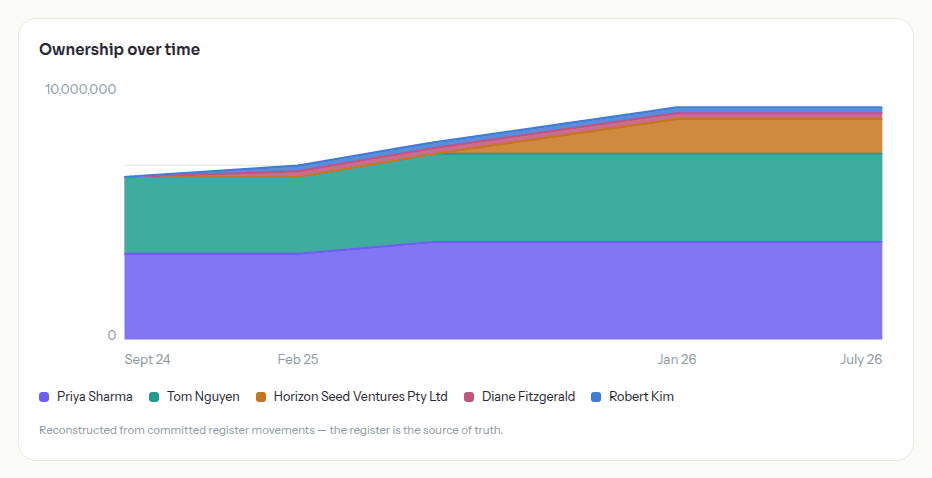
Ownership over time, reconstructed — not guessed
The ownership history chart isn't a separately maintained timeline someone updates by hand — it's rebuilt from the same committed register movements the cap table already reads, bucketed daily, weekly or monthly once there's enough span to make that meaningful. Ask how ownership has shifted since the seed round, and the answer comes straight from the record, not from someone's memory of what happened. It's the same discipline as everywhere else on the platform: one movement history, read a different way, rather than a second ledger someone has to keep matching to the first.
- Built entirely from committed register movements — nothing re-entered separately
- Buckets daily, weekly or monthly once the span makes that meaningful
- A sourced answer to how ownership has changed since any earlier date, not a recollection
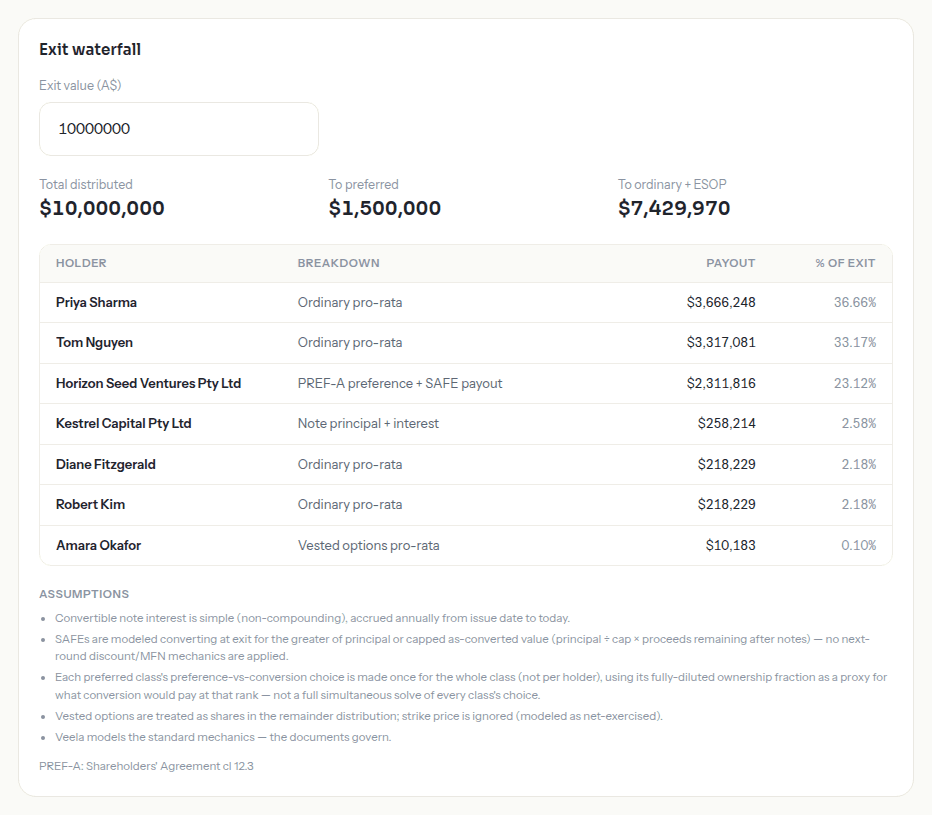
An exit waterfall that shows its working
Run an exit value through and Veela settles notes and SAFEs first, then works up the preference stack by rank — each preferred class rationally choosing between taking its preference and converting to ordinary — before splitting the remainder pro-rata across ordinary units, vested options and any converted or participating preferred. Every preference line cites the exact clause it relies on, the same citation a due-diligence reviewer will ask to see, so nobody has to take the number on faith. SAFE conversion is modelled as a documented approximation, not a substitute for the cap table your lawyer signs off on at the term sheet — treat the output as a rehearsal for the negotiation, not the settlement itself.
- Every preference line cites its clause — e.g. "PREF-A — Shareholders' Agreement cl 12.3"
- Notes and SAFEs settle first, then the preference stack by rank, then the pro-rata remainder
- SAFE conversion is a documented approximation — a guide for the room, not a signed cap table
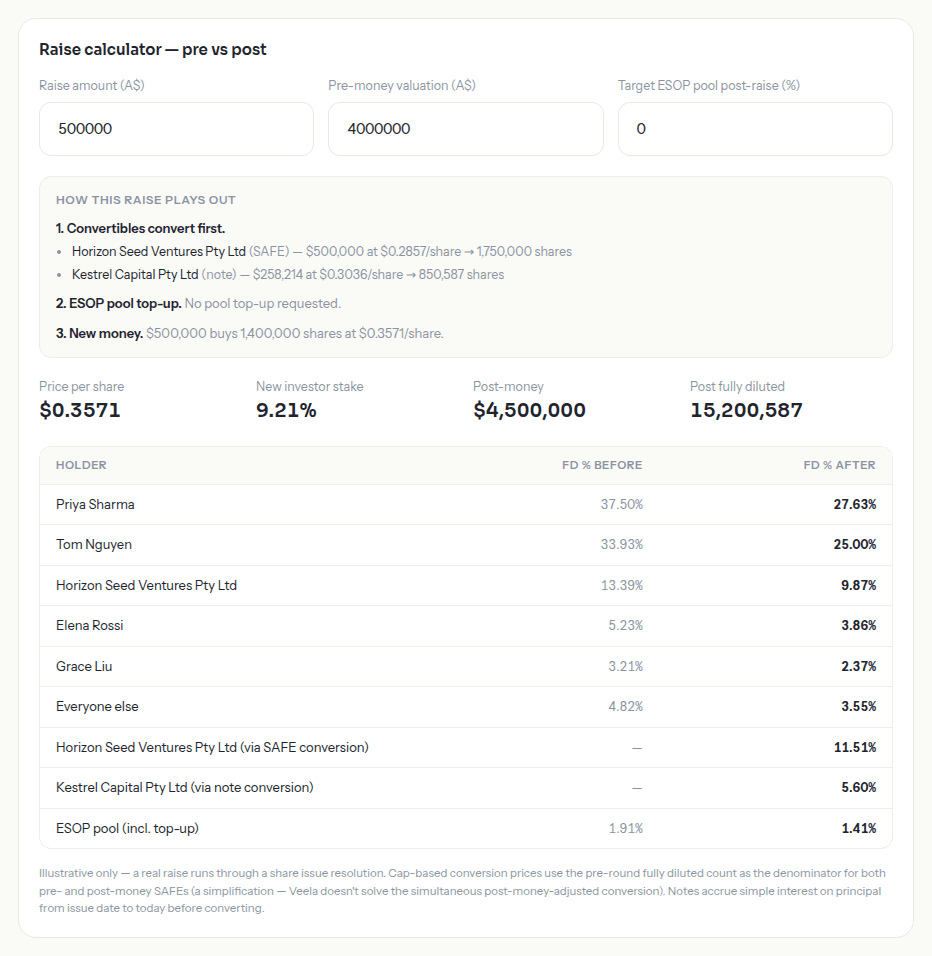
Model the raise before the term sheet, not after
Run a raise at whatever pre-money and amount you're actually discussing, and see the fully diluted percentage before and after side by side, with SAFE and note conversion and an ESOP pool top-up modelled in the same pass. None of it is committed — modelling never touches the register, and change only ever flows through a passed resolution with the right approvals attached. Run five scenarios before the meeting; only the one everyone agrees to actually happens, and only that one ever gets drafted, approved and written back to the register.
- Pre- and post-money, fully diluted percentage before and after, side by side
- SAFE and note conversion and an ESOP pool top-up modelled in the same pass
- Modelling never touches the register — change flows only through a passed resolution, with approvals
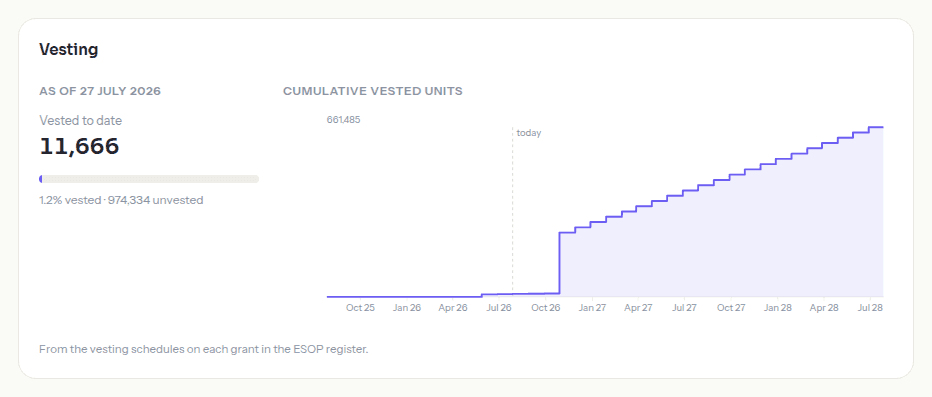
Vested to date, projected forward — not tracked by hand
Vested-to-date and what's still unvested come from the same place — the vesting schedule recorded on each grant in the ESOP register, not a spreadsheet someone updates after every cliff. Time-based tranches vest automatically as the schedule reaches its dates; a milestone tranche waits for a board confirmation before it counts as vested, so nothing vests on an assumption nobody signed off on. The chart projects cumulative vested units forward against the same live grants the cap table already reads — a forecast lens over the register, like everything else here, never a write back to it.
- Vesting computed from the schedule on each grant — nothing tracked by hand
- Time-based tranches vest automatically; milestone tranches wait for a board confirmation
- The same live ESOP register the cap table and option register already read from
Why this matters if you’re a Pty Ltd
An Australian cap table carries more legal weight than a spreadsheet usually gets — class rights your shareholders' agreement actually grants, an ESOP pool that has to reconcile with what's on the register, and an exit or raise that needs to run through the same governance as any other decision the board makes. Veela treats modelling as a lens on that record, not a replacement for it — you can look at the numbers from as many angles as you like, but only a passed resolution ever changes what's actually true.
Every number has a receipt
Waterfall lines and class rights each cite the clause they rely on, not a black-box formula — the same citation a due-diligence reviewer or your lawyer will ask to see before relying on it.
Modelling is a lens, not a write
Stress-testing an exit or a raise never touches the register. Only a passed, approved resolution changes what's actually on issue — modelling stays exploratory until someone signs.
Built for how an Australian raise actually runs
SAFE and note conversion, ESOP top-ups and a ranked preference stack, modelled the way an Australian term sheet actually works — cited where the rights are recorded, honest about where the maths is an approximation.
Not sure? Just ask Veela
Ask Veela reads the same cap table you're looking at — ask what an exit at a given value would pay each class, what a raise does to your percentage, or what the register looked like on an earlier date, and it answers from the live numbers with the citation attached. Nothing it proposes changes the register; that still needs a resolution and an approval.
- “What would our cap table look like as at 1 January?”
- “If we raise $2m at a $10m pre-money, what happens to my percentage?”
- “Walk me through what PREF-A gets in a $15m exit.”
- “How many fully diluted shares are on issue right now?”
- “Does this raise need an ESOP pool top-up first?”
Keep exploring
Personal signing links with no accounts to create, and an immutable minute book that fills itself.
Read more →Form 484 lodgement packs prepared the moment a resolution passes — send to your agent or self-file.
Read more →One library for every company file, and the context that grounds every Ask Veela answer.
Read more →See it running on your own facts
Start free for 7 days, or try the no-signup sandbox first — same platform, illustrative data.